



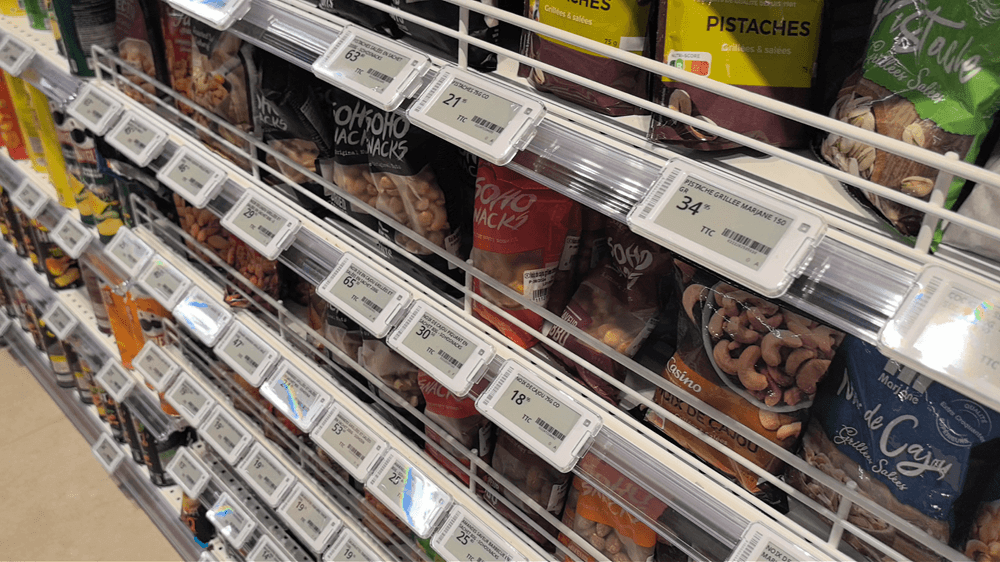
In a grocery store, a weekend promotion can create two rounds of work for the same products. Someone changes the shelf prices on Friday and restores them on Monday. If a product appears on both its regular shelf and an endcap, staff may need to change two tags each time.
Those repeated changes give retailers a practical way to evaluate digital price tags. In the illustrative example below, a store with a $12,000 upfront investment and $1,500 in annual operating costs would need about 212 physical tag changes per week to recover its investment in three years through labor savings. This is a worked example, not an industry benchmark. Your threshold will depend on how long each paper tag takes to change, how much work remains after digitization, and what the system costs to run.
Count the shelf tags your team actually changes
A pricing report tells you how many product prices changed. For this calculation, count how many physical tags staff had to replace. One SKU displayed in two locations can create two tag changes. A promotion that starts on Friday and ends on Monday can create two more rounds of work across those locations.
Pull four weeks of price changes from your POS or pricing system, then check how those updates translate to work on the floor. Include promotion starts and ends, regular price adjustments, and clearance markdowns. If your sample includes a holiday or a major seasonal reset, record that separately so you can estimate a representative week.
Next, time a few actual batches. Start when staff prepare or collect the printed tags and stop when they finish replacing and checking them. Divide the total staff minutes by the number of tags changed. If two employees work on the same batch, count both employees’ time.
Work out how much time digital price tags would save
Electronic shelf labels can receive price updates through an ESL management system. When the pricing system is integrated, staff can send updates to assigned labels in batches. The store still needs time to verify prices and handle exceptions. In a trial, record those minutes as well so the estimate reflects the work your team would actually save. How ESL connects with POS and inventory systems
Suppose a paper tag change takes two minutes of staff time. After accounting for the work that remains with electronic shelf labels, the store estimates a net saving of 1.5 minutes per tag change. At a fully loaded labor cost of $20 per hour, each eligible change saves $0.50 in staff time.
A store making 400 eligible changes per week would recover 10 staff hours each week under those assumptions. That is $200 in weekly labor value, or $10,400 over 52 weeks. The table values staff time at the stated hourly rate. The time freed up can go to replenishment, shelf care, or customer service.
Calculate how many changes you need to break even
Start with the upfront cost for the area you plan to equip. Include tags, mounting accessories, gateways, installation, and any one-time integration work. Then estimate annual running costs such as software fees, support, and replacement supplies. Ask for both figures when requesting a quote. Electronic shelf label cost breakdown.
Use this calculation for a simple payback estimate.
Weekly tag changes needed = (upfront investment ÷ target payback years + annual running costs) ÷ (labor value saved per tag change × operating weeks per year)
With the figures above, the store needs $4,000 per year to recover the upfront investment over three years. Add $1,500 in annual running costs and the required labor value rises to $5,500 per year. At $0.50 per change over 52 weeks, each weekly change is worth $26 a year, so the store needs $5,500 ÷ $26 ≈ 212 eligible tag changes per week, rounded up.
| Eligible tag changes per week | Annual labor value | Annual value after running costs | Simple payback |
|---|---|---|---|
| 200 | $5,200 | $3,700 | 3.2 years |
| 400 | $10,400 | $8,900 | 1.3 years |
| 600 | $15,600 | $14,100 | 0.9 years |
These figures are illustrative assumptions for a store evaluating its options. Simple payback assumes steady annual savings and running costs. The table values staff time at the stated hourly rate, so use the portion you can actually capture if your finance team requires a cash payback estimate. The estimate also leaves out several items you may want to add for your own store: label battery or unit replacement, lost or damaged labels, savings on printing paper, ink and equipment, and the cost of price mismatches between shelf and checkout. It does not account for the cost of capital either.
See how the threshold moves with your assumptions
The break-even point is sensitive to two inputs: how much time each change really saves, and how much the system costs. The table below shows the weekly changes needed for a three-year payback, assuming $1,500 in annual running costs, $20 per hour labor, and 52 operating weeks.
| Net minutes saved per change | $6,000 upfront | $12,000 upfront | $18,000 upfront |
|---|---|---|---|
| 0.5 | 404 | 635 | 866 |
| 1.0 | 202 | 318 | 433 |
| 1.5 | 135 | 212 | 289 |
| 2.0 | 101 | 159 | 217 |
Read across the row that matches your measured time saving and down the column closest to your quote. The result is a starting point for comparing departments, not a prediction of savings.
Look for the departments with the most repeat work
A storewide average can hide where electronic shelf labels would save the most time. Fresh food may have frequent markdowns. A promotional aisle may need two rounds of price changes every week. Other departments may keep the same shelf prices for weeks at a time.
Measure tag changes by department before choosing where to start. For a limited rollout, count only the price changes that would reach the labels in scope and use the quote for that configuration. Include any shared gateway, software, or integration costs the pilot needs. Those fixed costs can make a small installation look expensive per label, even when the chosen department gives you a useful test of the day-to-day savings.
Price accuracy can also matter to the decision. If your team regularly corrects shelf prices that differ from the checkout price, track how often that happens and how long it takes to resolve. Keep that figure separate from routine tag-changing time so each benefit can be assessed on its own.
Test the estimate during a full promotion cycle
Choose a department that reflects the work you want to reduce. Record how long paper updates take during a normal promotion cycle, including the return to regular prices. Repeat the measurement with digital price tags. Include the time spent checking the shelf against the POS and correcting any labels that need attention.
Use the measured savings to recalculate the weekly threshold. In the example above, if the trial saves one minute per change instead of 1.5 at $20 per hour, the three-year threshold rises from 212 to 318 changes per week. A half-minute difference can change which departments make sense to equip first.
If you are evaluating MinewTag electronic shelf labels, bring your estimated label quantity, and POS setup when requesting a quote. A quote for the area you plan to equip gives you the cost inputs to compare with the time your team measured on the floor. Explore MinewTag electronic price labels and request a quote.


